Sumo Elo Ratings
1 Latest Basho Elo Rankings
For rankings and match forecasts for the latest tournament, go to this page
2 Introduction
Sumo, Japan’s national sport, has centuries of tradition and a highly structured system of competition.
This webpage explores wrestler performance through Elo ratings, a method commonly used in chess and video games to track relative skill over time.
The goal is to see how well Elo captures wrestler strength compared to the official banzuke (ranking) system. Elo scores can help gauge the relative strength of rikishi in a given match, and provide a fuller picture of a wrestler’s record than a simple win-loss record. Elo can also help track the prowess of a wrestler over time, showing trends in performance.
3 Background
3.1 Sumo
Elo ratings provide a way of updating a competitor’s strength based on match outcomes, rewarding unexpected victories more heavily than easy wins.
Basic sumo facts:
- Wrestlers compete in six honbasho (grand tournaments) per year, in each of the odd-numbered months
- The Japan Sumo Association publishes the official banzuke ranking before each tournament, based on recent records and judgment by the ranking committee.
- Each top-division wrestler fights 15 bouts per basho, one for each day of the tournament.
3.2 Elo Calculations
Wrestlers are assigned an initial Elo rating of 1500, a common baseline in Elo systems. Each bout updates the wrestlers’ ratings based on the expected outcome vs. the actual result.
The Elo system is built on log-odds: the difference in ratings corresponds to the logarithm of the expected odds. A difference of 400 points means the higher-rated wrestler is expected to win about ~91% of the time — equivalent to 10-to-1 odds.
The formula for expected win probability of Wrestler A against Wrestler B is:
\[ P(A \,\,\text{wins}) = \frac{1}{1 + 10^{-(R_A - R_B)/400}} \]
Where \(R_A\) and \(R_B\) are the Elo ratings of the two wrestlers.
Here is a quick reference table converting Elo differences into win probabilities and approximate betting odds:
| Elo Difference | Win Probability | Approx. Odds |
|---|---|---|
| 400 | 90.1% | 10-to-1 |
| 200 | 76% | 3-to-1 |
| 100 | 64% | 7-to-4 (≈2-to-1) |
| 50 | 57% | 4-to-3 |
Intuitively, small rating gaps imply relatively even contests, while large gaps indicate overwhelming favorites.
After each match, the Elo of a wrestler is updated according to
\[ R_{new} = R_{old} + \lambda ( W - P(A\,\,\text{wins})) \] where \(W\) is the match outcome, equal to 1 if \(A\) win and 0 if \(A\) loses, and \(\lambda\) is the learning rate, which I’ve set to 10. I’ve experimented with adding a momentum term to the update and with higher learning rates for novice rikishi, but it’s hard to beat this simple formula.
4 Elo History for Selected Wrestlers
One way to appreciate the Elo system is to track how ratings evolve for individual wrestlers across their careers.
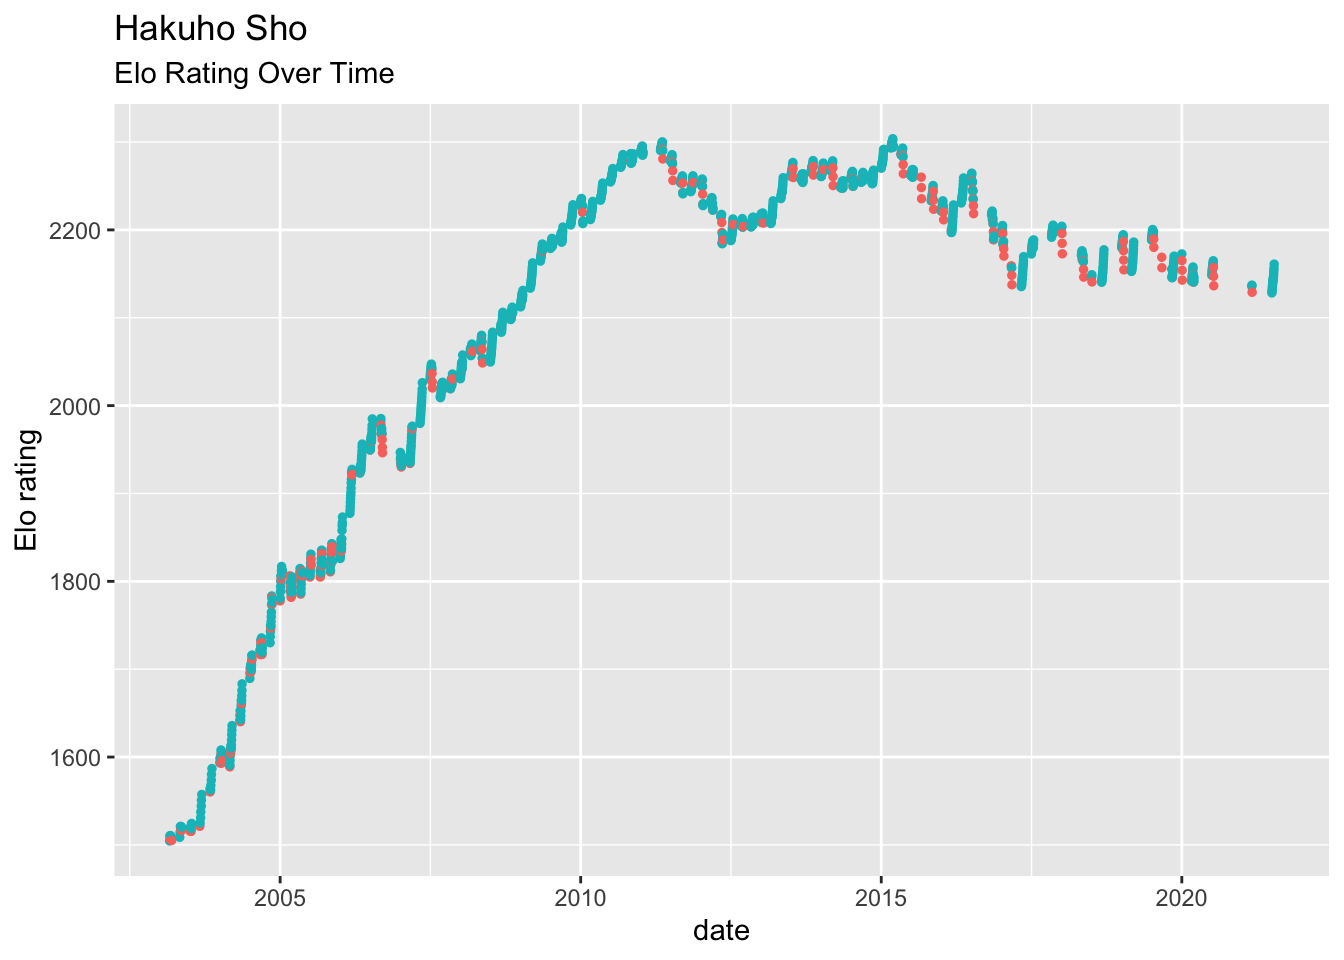
4.1 Example: Hakuho
- Hakuho is widely regarded as the most dominant Yokozuna in modern sumo.
- His Elo score peaked at extraordinary levels, reflecting long streaks of dominance.
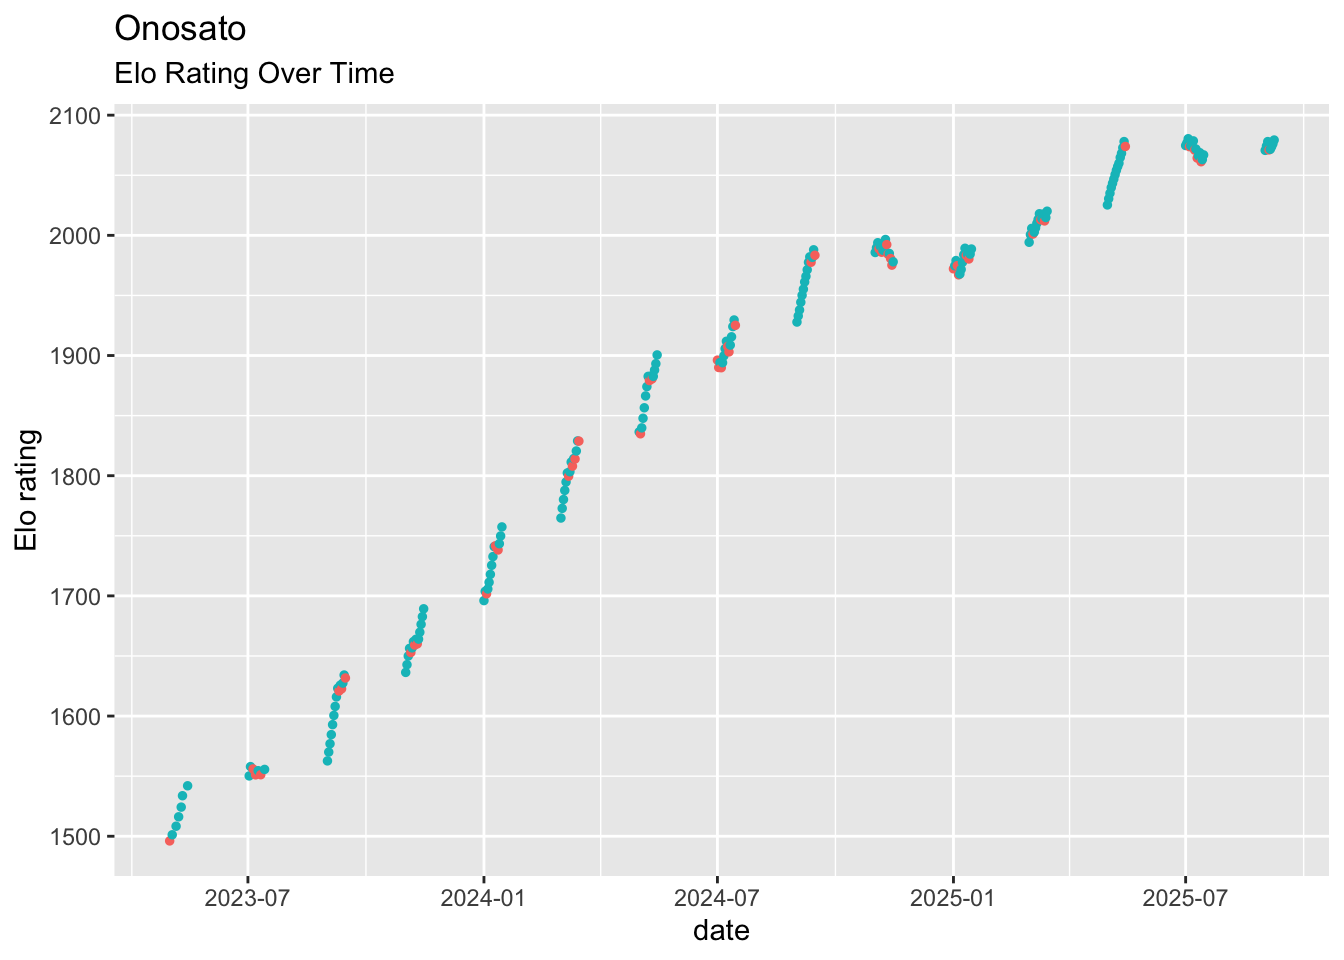
As another example, here is the astounding rise of current yokozuna Onosato over the last few basho.
4.2 Highest Ever Elo Scores
Using Elo’s computed since 2000, here is a list of the 10 higest Elo scores ever recorded. Are these the 10 best rikishi of the 2000’s? In any case, its remarkable how Hakuho dominates all other rikishi in Elo, almost 150 points higher than the next best.
| Rikishi | Basho | Max Elo |
|---|---|---|
| Hakuho Sho | 5/2011 | 2444 |
| Asashoryu Akinori | 5/2007 | 2301 |
| Kisenosato Yutaka | 3/2017 | 2263 |
| Harumafuji Kohei | 3/2013 | 2247 |
| Terunofuji Haruo | 1/2022 | 2226 |
| Kakuryu Rikisaburo | 1/2017 | 2214 |
| Onosato | 11/2025 | 2204 |
| Baruto Kaito | 3/2012 | 2195 |
| Hoshoryu | 1/2026 | 2161 |
| Goeido Gotaro | 11/2016 | 2147 |
5 Accuracy and Calibration
This shows accuracy according to common scoring rules, the Brier score and the log loss. For a coin flip prediction on an even match, we’d expect a Brier score of 0.25 and an average surprisal of 1. So the Elo gives a slightly better than chance forecast. The forecast is slightly better for Makkuchi, where there is more Elo differentiation, than for matches overall.
| Accuracy Measure | All Matches | Makuuchi Only |
|---|---|---|
| Brier score | 0.244 | 0.231 |
| Average surprisal | 0.983 | 0.943 |
Next up is a calibration plot which shows the realized win rate as a function of the forecast win rate. If the forecast is good, we would expect the win average in each bucket to line up exactly with the forecast win rate, which is the diagonal line corresponding to \(y=x\). That is, when the forecast from Elo scores says a rikishi has a 25% chance of winning, how often does he actually win on average?
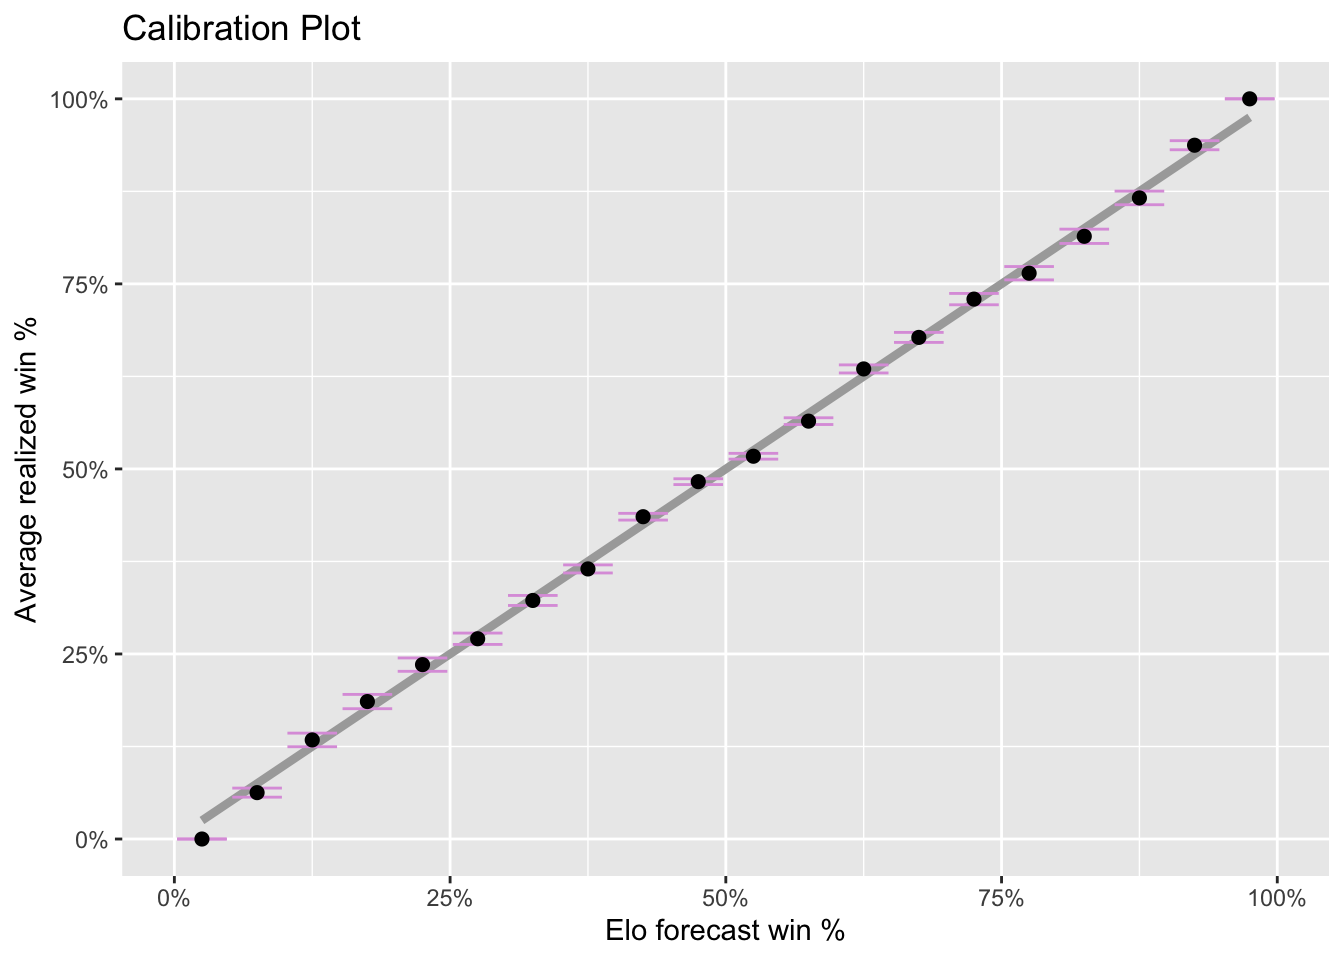
Overall the agreement is pretty good, though the line \(y=x\) doesn’t always fall within the 2-\(\sigma\) error bars.
6 Other Technical Details
The code for this project lives at https://github.com/mccorvie/sumo.
I’m Ryan McCorvie, the author of this analysis. Feel free to contact me at ryan@martingale.ai.
Match data is provided by the amazing resource Sumo API. Consider donating money to support that site!